
COLUMN
02/11/2026
Next.js in Production Needs More Than console.log: Logging, Metrics, and Tracing When You Self-Host
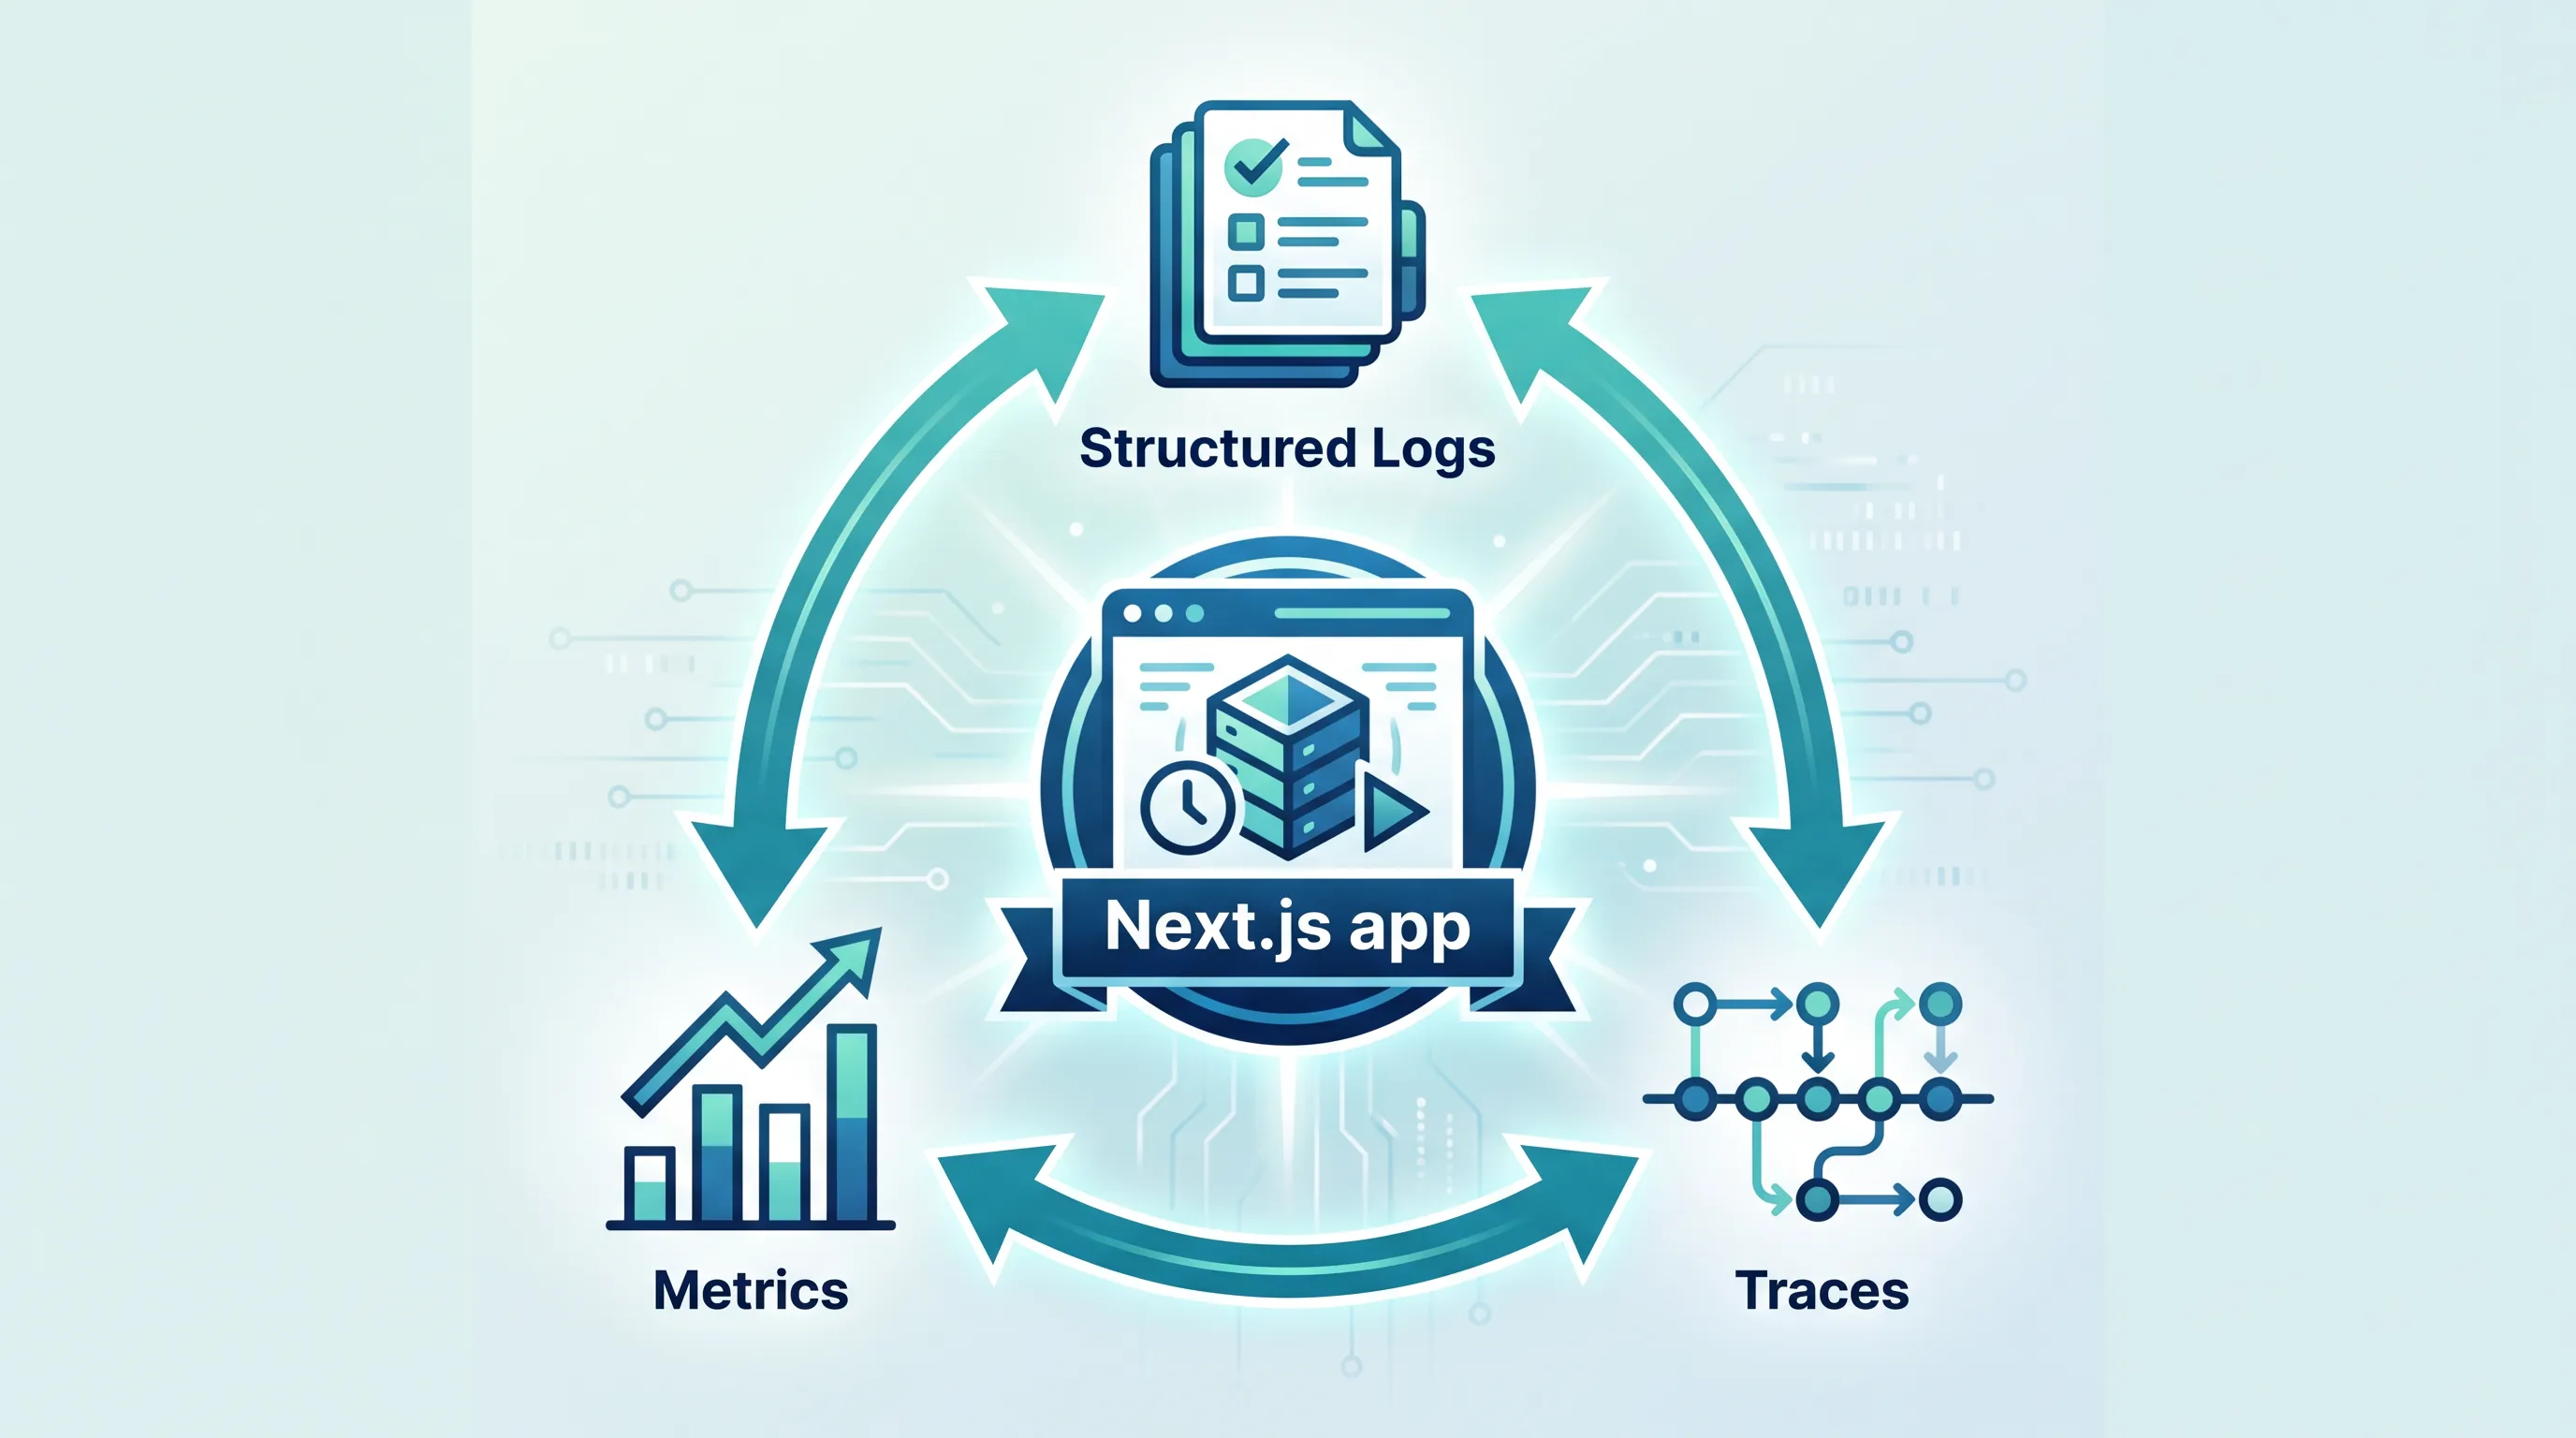
Your Next.js app is running fine in staging. Then it's in production, a request hangs, and all you have is a console.log buried somewhere in an API route — if you remembered to leave it in. By the time you've SSH'd into the container and grepped through stdout, the user has already refreshed the page and the error is gone.
This is the gap between "it runs" and "it's observable." Vercel's platform quietly gives you request logs, function traces, and basic metrics out of the box. The moment you self-host — on a VM, a Docker host, or Kubernetes — that instrumentation disappears, and you have to build it yourself. This guide covers what to actually set up: structured logging, metrics, and distributed tracing for a self-hosted Next.js app, using the tools that already exist for this rather than reinventing them.
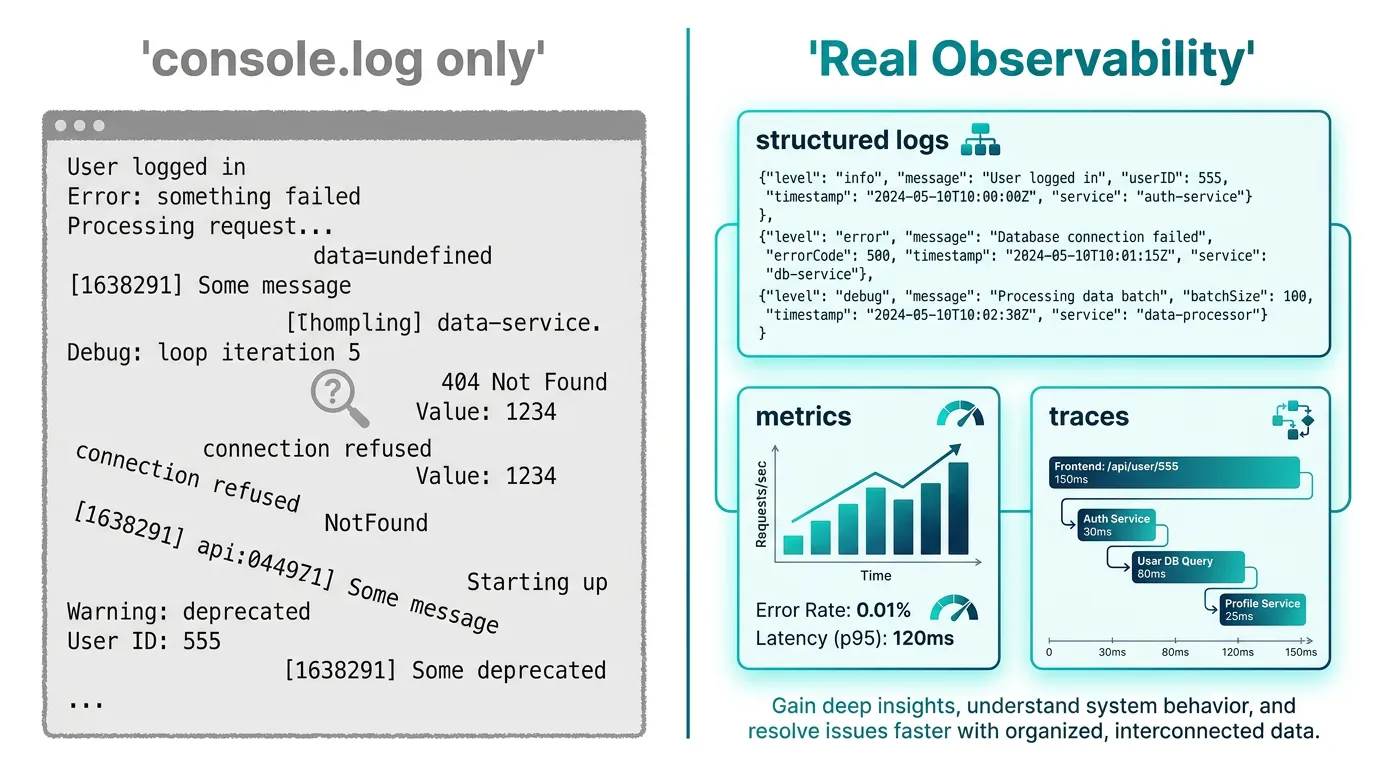
Why console.log stops working in production
In local development, console.log is fine: you have one process, one terminal, and you're the only one watching it. In production, that breaks down for a few concrete reasons:
- Multiple instances. If you're running more than one container or pod for redundancy, your logs are now scattered across N stdout streams with no way to correlate a single request across them.
- No request context. A bare
console.log("user fetch failed")doesn't tell you which user, which request, or what happened immediately before it in the same request lifecycle. - No structure to query. Plain text logs are fine for
tail -f, but useless the moment you need to ask "how many 500s did we return between 2 and 3 a.m." across a week of history. - Nothing survives a restart. If your orchestrator restarts a crashed container, the stdout buffer that had the stack trace explaining why it crashed often goes with it, unless something was already shipping those logs elsewhere.
None of this is a Next.js problem specifically — it's what every team hits the first time they run a stateful web process outside of a platform that handles it for them. The fix is the same three-part stack used across most production Node.js services: structured logs, metrics, and traces.
Structured logging: give every log line a shape
The first change is mechanical: stop writing free-text strings and start writing JSON objects with consistent fields. A minimal structured logger for a Next.js route handler looks like this:
// lib/logger.js
function log(level, message, fields = {}) {
  const entry = {
    level,
    message,
    time: new Date().toISOString(),
    ...fields,
  };
  process.stdout.write(JSON.stringify(entry) + "\n");
}

export const logger = {
  info: (message, fields) => log("info", message, fields),
  warn: (message, fields) => log("warn", message, fields),
  error: (message, fields) => log("error", message, fields),
};
Used inside a Route Handler:
// app/api/orders/route.js
import { logger } from "@/lib/logger";
import { randomUUID } from "crypto";

export async function POST(request) {
  const requestId = randomUUID();
  try {
    const body = await request.json();
    logger.info("order.create.start", { requestId, customerId: body.customerId });

    const order = await createOrder(body);

    logger.info("order.create.success", { requestId, orderId: order.id });
    return Response.json(order);
  } catch (err) {
    logger.error("order.create.failed", {
      requestId,
      error: err.message,
      stack: err.stack,
    });
    return Response.json({ error: "order_failed" }, { status: 500 });
  }
}
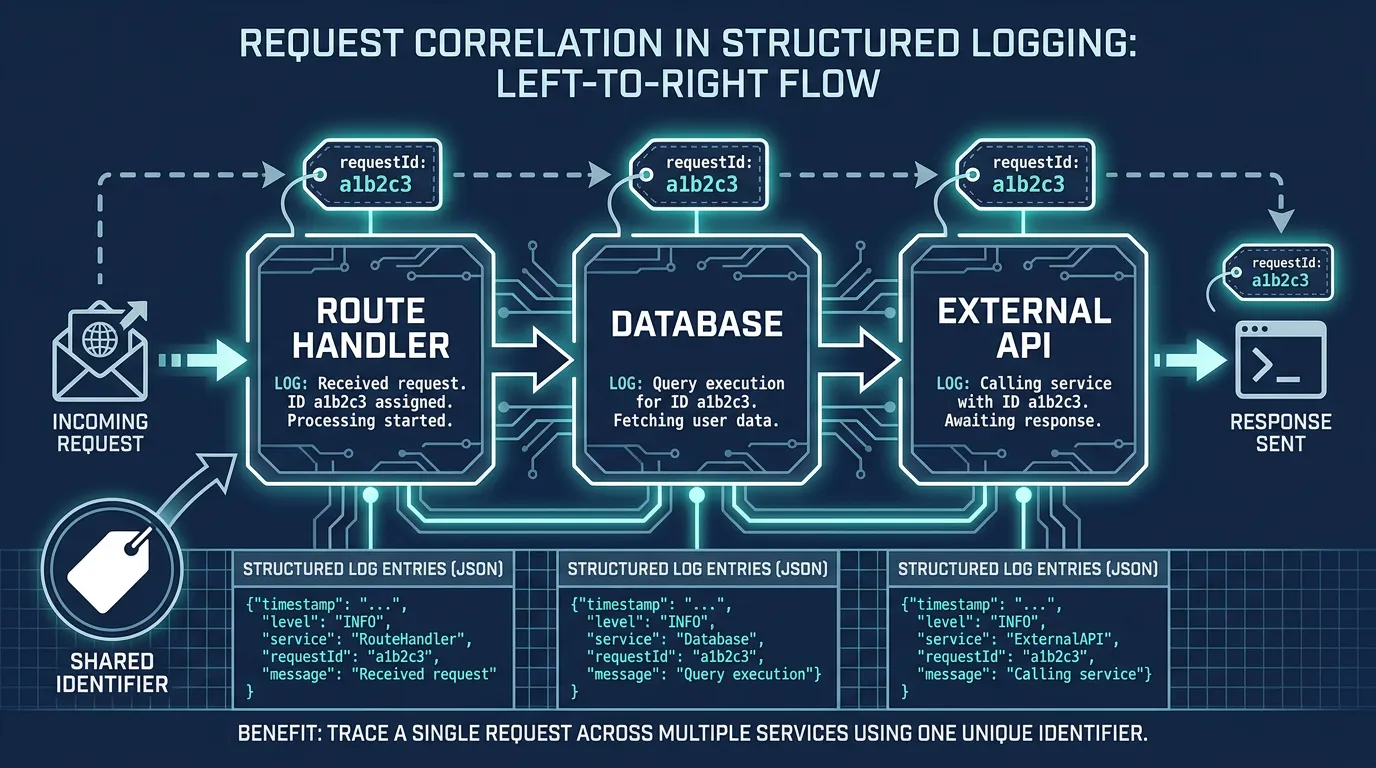
Two things matter here that a bare console.log doesn't give you:
- A
requestIdthat ties every log line from a single request together, even across async calls, retries, or multiple services. - Writing to stdout as JSON, not plain text. This is intentional, not a style choice: in a container environment, stdout is almost always already captured by the container runtime (Docker's
json-filedriver, containerd, or your Kubernetes node's logging agent). If the JSON is structured, whatever collects those logs downstream — Loki, Vector, or a managed log pipeline — can parse and index fields without you writing a custom parser.
If you want a battle-tested logger instead of a 15-line function, pino is the standard choice for Node.js: it's fast, writes structured JSON by default, and integrates cleanly with the Next.js Node.js runtime. (It does not work in the Edge Runtime, since Edge functions don't have Node's process API — keep logging in Edge middleware to console.log, which Next.js already forwards as structured output when deployed on most platforms.)
Metrics: counts and timings, not log lines
Logs answer "what happened on this one request." Metrics answer "how is the system behaving overall" — request rate, error rate, latency percentiles — without having to scan every log line to find out. The standard here is Prometheus's exposition format: your app exposes a /metrics endpoint, and a Prometheus server scrapes it on an interval.
For a self-hosted Next.js app, prom-client is the library most teams reach for:
// lib/metrics.js
import client from "prom-client";

export const register = new client.Registry();
client.collectDefaultMetrics({ register });

export const httpDuration = new client.Histogram({
  name: "http_request_duration_seconds",
  help: "Duration of HTTP requests in seconds",
  labelNames: ["method", "route", "status"],
  buckets: [0.05, 0.1, 0.3, 0.5, 1, 2, 5],
});
register.registerMetric(httpDuration);
// app/api/metrics/route.js
import { register } from "@/lib/metrics";

export async function GET() {
  const body = await register.metrics();
  return new Response(body, {
    headers: { "Content-Type": register.contentType },
  });
}
Then wrap the handlers you care about so the histogram actually gets values:
// app/api/orders/route.js
import { httpDuration } from "@/lib/metrics";

export async function POST(request) {
  const end = httpDuration.startTimer({ method: "POST", route: "/api/orders" });
  try {
    const order = await createOrder(await request.json());
    end({ status: "200" });
    return Response.json(order);
  } catch (err) {
    end({ status: "500" });
    return Response.json({ error: "order_failed" }, { status: 500 });
  }
}
A few things that trip people up the first time:
/api/metricsshould not be public. It's internal operational data. Restrict it at the network layer (only your scraper's IP range can reach it) rather than trying to handle auth inside the route itself.- On Vercel, this pattern mostly doesn't apply, because Vercel's serverless functions are short-lived and don't hold a persistent
Registrybetween invocations — the counters reset constantly. This is one of the concrete things you get back by self-hosting on a long-running process: metrics that actually accumulate. - Default metrics are worth collecting even before custom ones.
client.collectDefaultMetrics()gives you Node.js process memory, event loop lag, and GC pause time for free, which catches a surprising number of production issues (slow memory growth, event loop blocking) before they become outages.
Distributed tracing: following one request across services
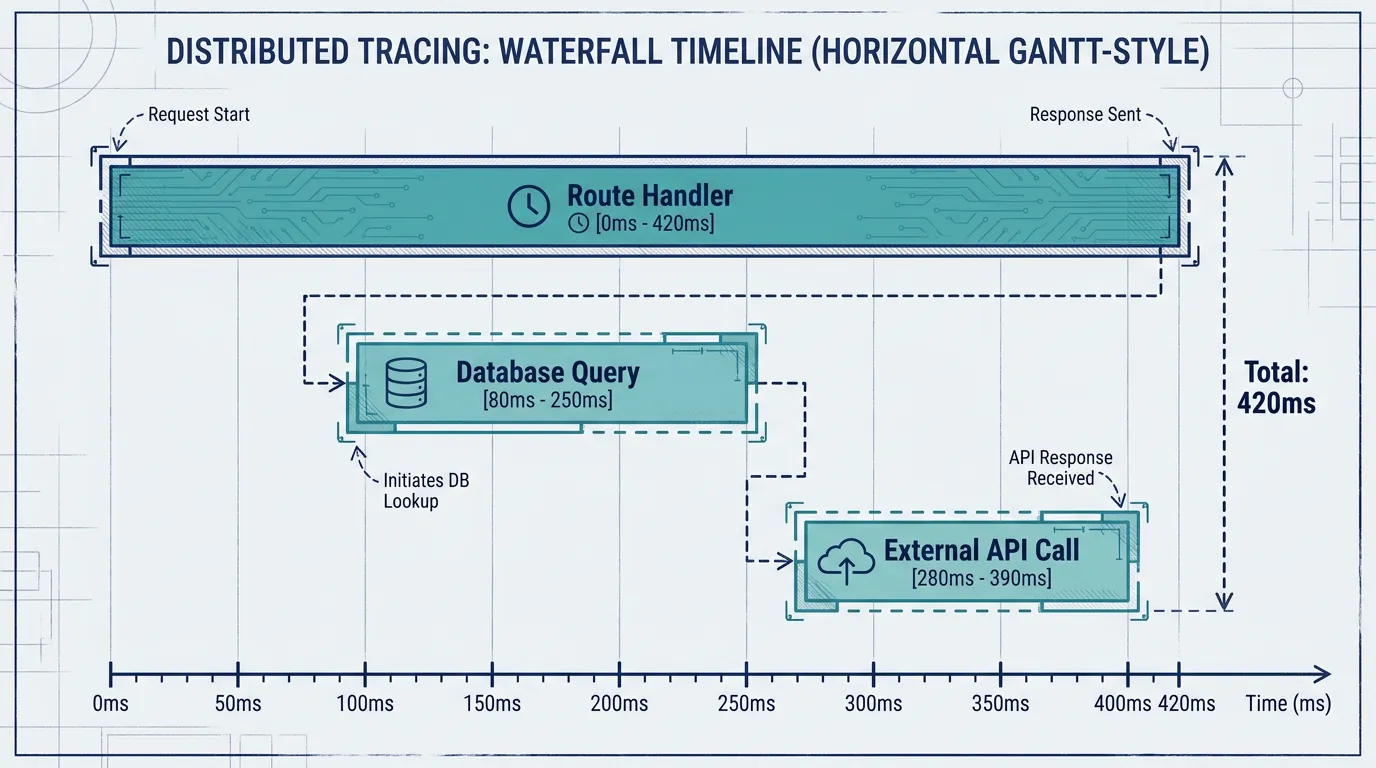
Logs and metrics tell you that something was slow. Tracing tells you where — which part of a request's path (your Next.js server, the database, a downstream API) actually ate the time. This matters more as soon as a Next.js app stops being the only service: it's calling a database, maybe a cache, maybe an internal API, and a single slow request could be any one of them.
OpenTelemetry is the standard here, and Next.js has built-in support for it via instrumentation.js:
// instrumentation.js
export async function register() {
  if (process.env.NEXT_RUNTIME === "nodejs") {
    const { registerOTel } = await import("@vercel/otel");
    registerOTel({ serviceName: "my-nextjs-app" });
  }
}
That single hook, combined with an OpenTelemetry Collector pointed at a tracing backend, gives you a timeline for every request: how long the Route Handler took, how long the database query inside it took, and how long any outbound fetch call took — as one connected trace instead of three unrelated log lines you have to mentally stitch together.
Setting up the collector and a storage backend (Tempo, Jaeger, or similar) is enough work that it deserves its own walkthrough — this guide to implementing distributed tracing with OpenTelemetry covers wiring the collector, exporting to a backend, and reading the resulting traces in practice.
Where this gets heavier than it looks
None of the three pieces above is hard in isolation. What's easy to underestimate is what it takes to run all three continuously, in production, without someone babysitting it:
- A log pipeline that doesn't fall over under load and doesn't quietly drop entries when the collector restarts
- A Prometheus server (or managed equivalent) with retention and alerting rules, not just a
/metricsendpoint nobody looks at - An OpenTelemetry Collector and trace storage backend that stays up, plus the glue to keep all of this talking to the same service running on multiple replicas
This is the point where a lot of teams realize they're no longer running "a Next.js app" — they're running a small observability platform in addition to a Next.js app, usually on infrastructure (a single Docker host, a couple of VMs) that was never meant to carry that. That's also roughly the point where Kubo tends to come up in these conversations: it's standard Kubernetes with the Prometheus and logging plumbing already wired in, so the instrumentation code above has somewhere production-grade to send data without your team separately operating the collector and storage layer for it.
If your current setup is a Docker Compose file on one host and you're already feeling this — scaling the app means scaling the sidecar services too, and there's no real isolation between them — that's usually the sign it's time to look at moving from a single Docker host to Kubernetes rather than adding more services to the same box.
Start with logs, add the rest when you need it
You don't need all three on day one. A reasonable order:
- Structured logging first. It's the lowest effort and immediately replaces guesswork with searchable data.
- Metrics next, once you have more than one instance and need to know if the fleet as a whole is healthy, not just one box.
- Tracing last, once a request touches enough services that "which part was slow" stops being obvious from logs alone.
The common thread across all three is that they assume a long-running process that can hold state (a metrics registry, a trace context) between requests — which is exactly what you get by self-hosting on a persistent server instead of short-lived serverless functions. If you're already down that path, the instrumentation above is what turns "it's slow sometimes" into an answerable question.