
COLUMN
05/10/2026
Next.js Fetch Logging in Production: What next.config.js Controls
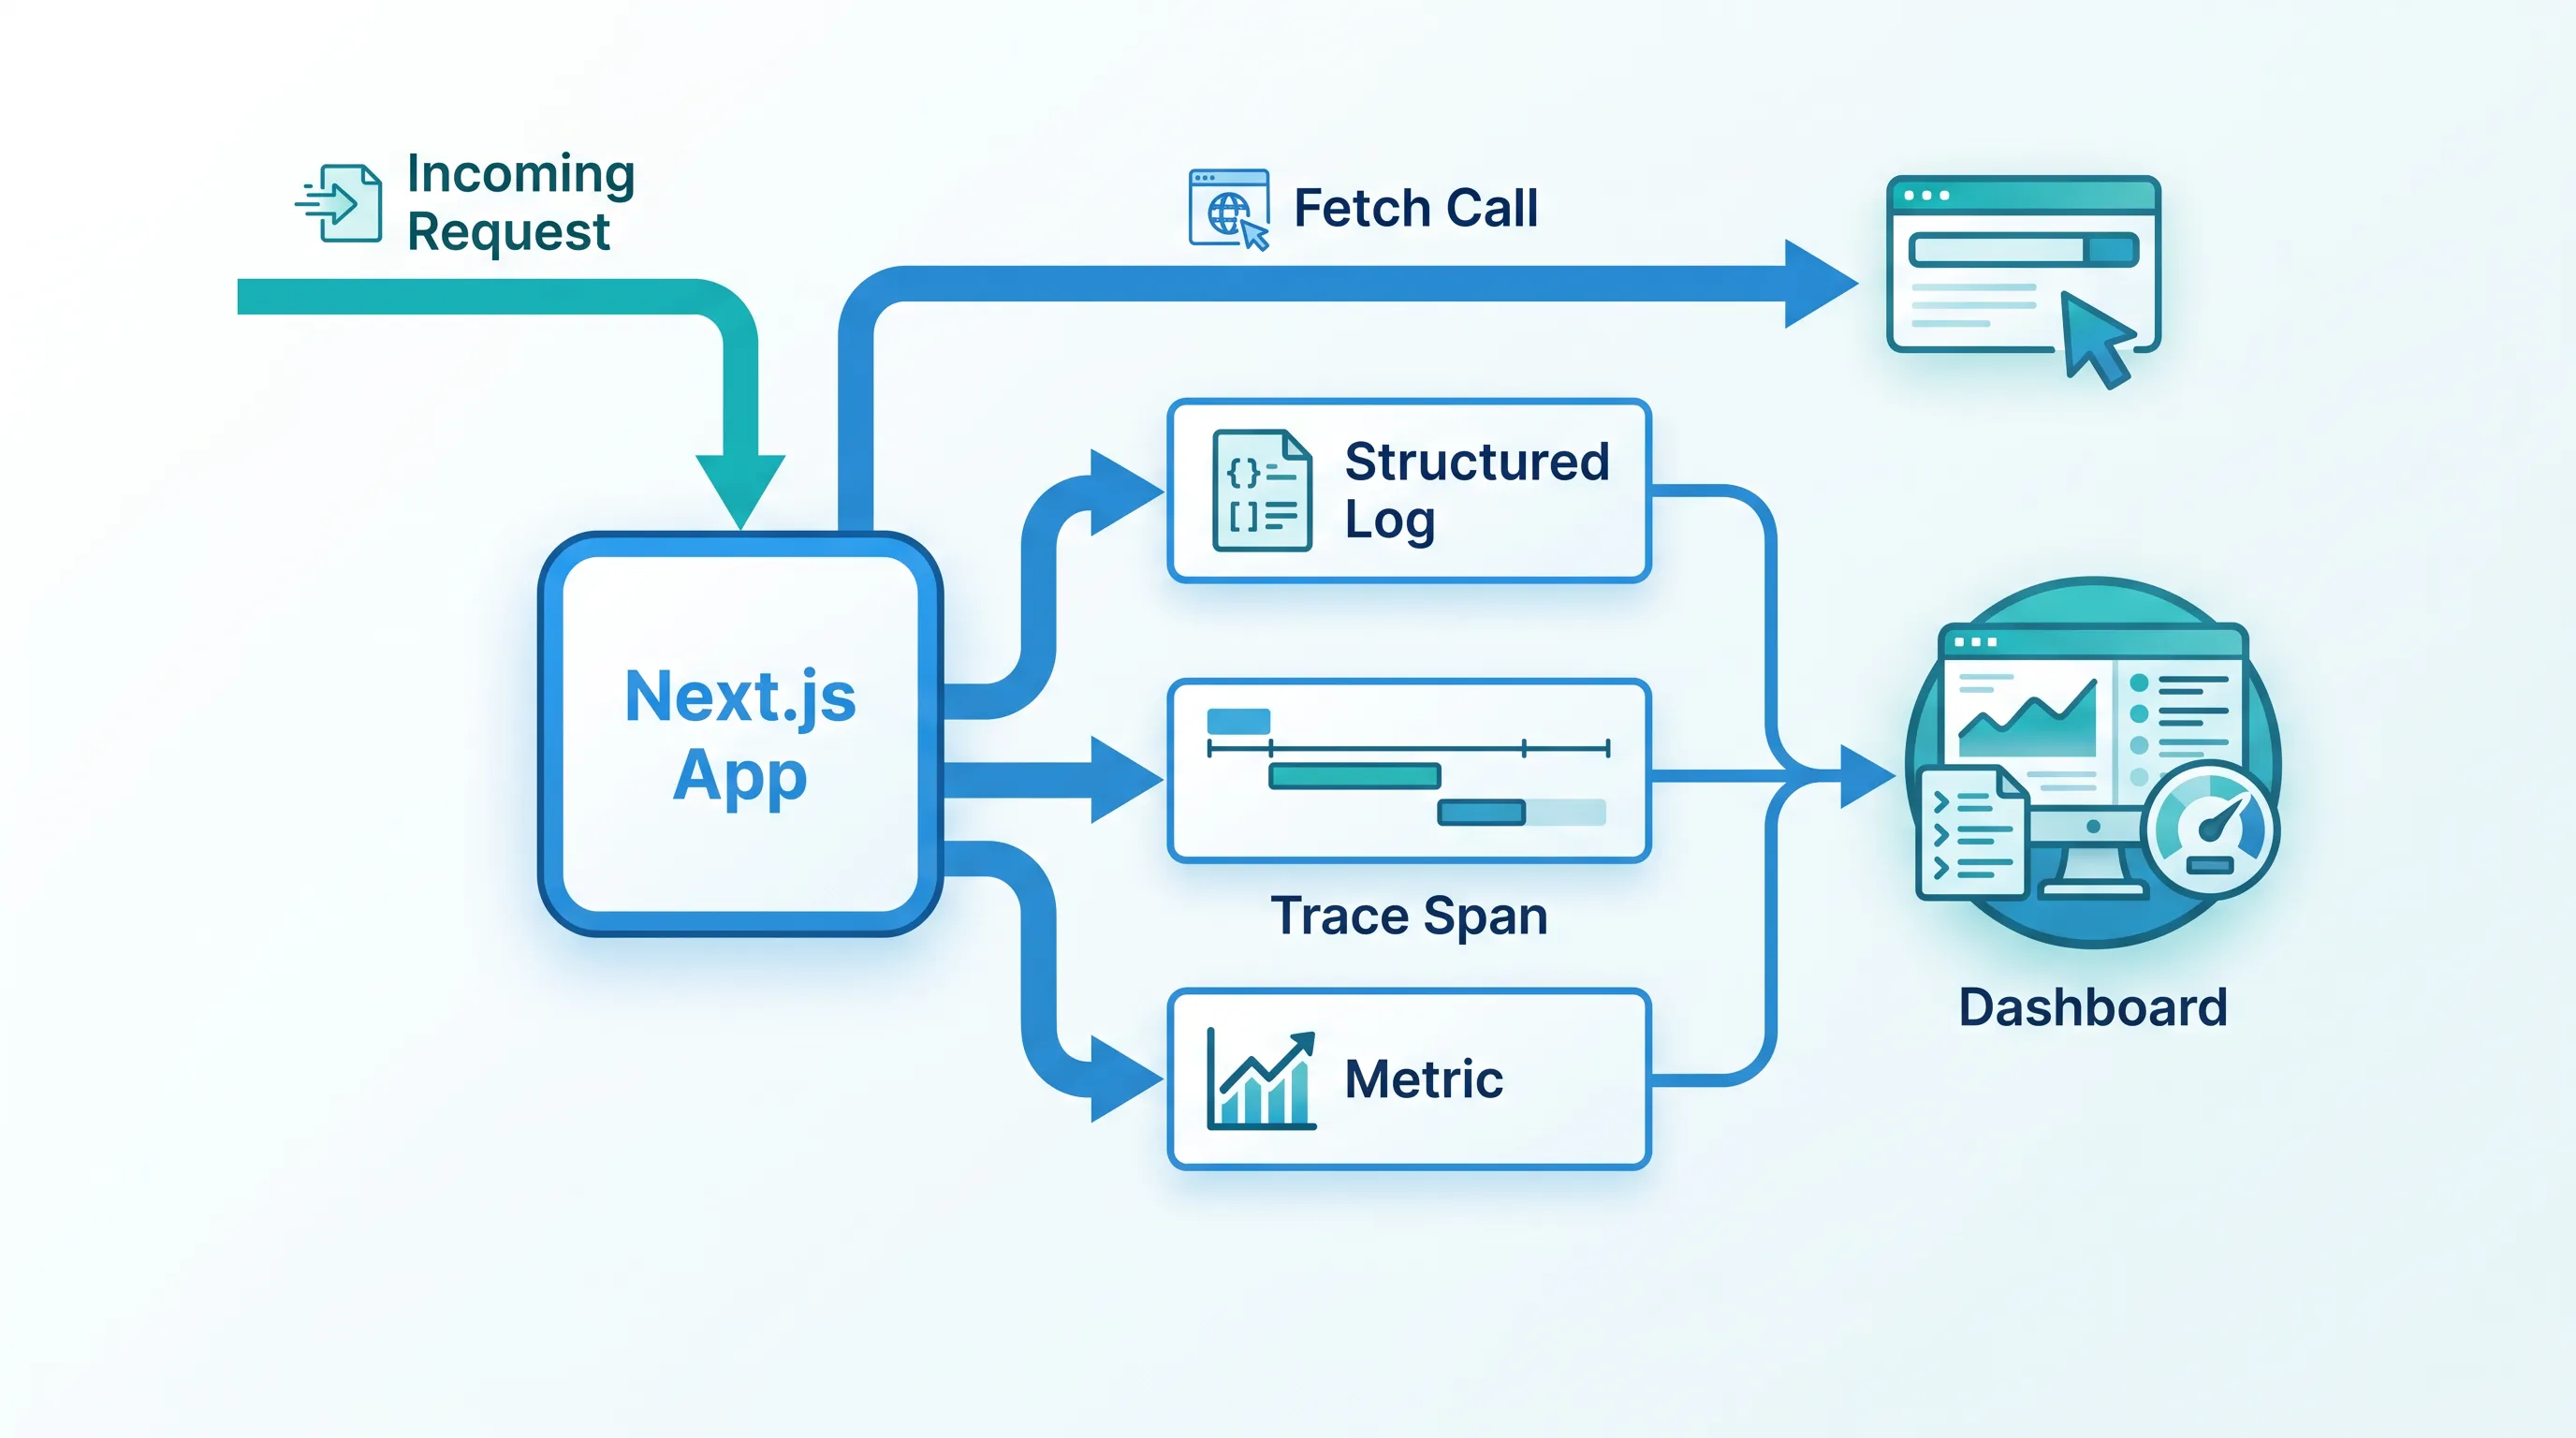
Every fetch call your Next.js app makes on the server gets logged by default in development — and by default, none of it shows up the same way once you deploy. That gap between the dev console and a production log stream is where most teams either drown in noise or lose the one error they actually needed to see. This guide covers what the logging option in next.config.js actually controls, what it doesn't, and how to wire it into something you can search in production.
What next.config.js's logging option does
Next.js logs fetch requests made during rendering in the terminal during next dev by default. In production (next start), that verbose fetch logging is off unless you turn it on explicitly. The option lives under logging in next.config.js:
// next.config.js
module.exports = {
  logging: {
    fetches: {
      fullUrl: true,
      hmrRefreshes: true,
    },
  },
}
fetches.fullUrl— logs the complete request URL instead of a truncated path. Useful when you're debugging which query parameters actually reached a cached fetch.fetches.hmrRefreshes— repeats fetch logs on Fast Refresh in development; it has no effect in a production build.- Setting
logging: falseat the top level suppresses this fetch logging entirely, which is the default outside ofnext devfor anything you haven't explicitly enabled.
What this option does not do: it doesn't touch your own console.log calls, it doesn't format output as JSON, and it doesn't ship anything anywhere. It's a switch for Next.js's internal fetch instrumentation, not a logging framework. If you were expecting structured, queryable logs out of the box, next.config.js alone won't get you there — see the official caching and logging docs for the current default behavior per Next.js version, since this has changed across major releases.
Why fetch logs multiply faster than you expect
The fetch logging in next.config.js reports every server-side fetch() call made during rendering — including ones the App Router deduplicates or serves from its own cache. On a page with a dozen components each fetching from a shared data layer, that's a dozen log lines for what might resolve to two or three actual network calls. Multiply that by concurrent requests in production and the fetch log becomes noise that buries the request that actually failed with a 500.
The practical fix isn't to log less — it's to log at the right layer. Two approaches teams commonly land on:
- Log at the boundary, not the request. Wrap your data-fetching functions and log only failures, timeouts, and unexpected status codes, rather than every attempt. This turns "12 log lines per page load" into "0 log lines unless something is wrong."
- Correlate, don't just count. Attach a request ID to every log line tied to a single incoming HTTP request, so a spike in errors during a deploy can be traced back to one user's session rather than grepped for by timestamp.
// lib/fetch-with-logging.ts
export async function fetchWithLogging(url: string, requestId: string) {
  const start = Date.now()
  try {
    const res = await fetch(url)
    if (!res.ok) {
      console.error(JSON.stringify({
        requestId,
        url,
        status: res.status,
        durationMs: Date.now() - start,
      }))
    }
    return res
  } catch (err) {
    console.error(JSON.stringify({ requestId, url, error: String(err) }))
    throw err
  }
}
That's still console.error under the hood — but structured as JSON, it becomes filterable once it reaches a log aggregator, instead of a wall of text.
Where those logs actually go once you're self-hosting
In a container, console.log and console.error both write to stdout/stderr, and that's the last decision Next.js makes for you. What happens after that is entirely up to your runtime. On a single container with no log driver configured, those lines vanish once the container restarts — which is exactly when you need them most, right after a crash.
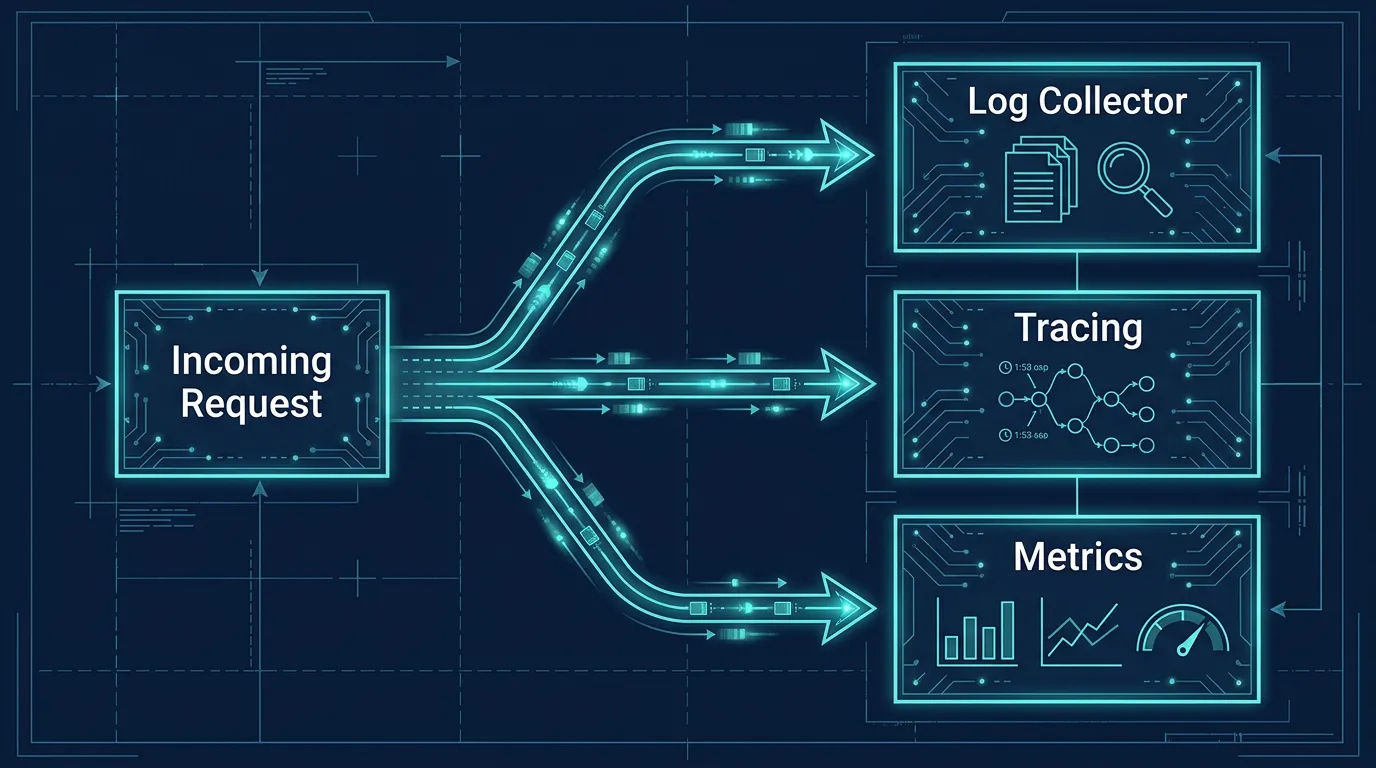
Once you've tamed the fetch noise at the source, the next question is where those logs go in production. Most self-hosted teams end up wiring stdout into a log collector (Fluent Bit, Vector, or a sidecar) that ships structured JSON lines into something searchable, and pairing that with metrics from a full monitoring stack and distributed tracing so a request ID in a log line can be cross-referenced against a trace span, not just re-read as text. Logging tells you that something failed; tracing tells you where in the request it failed, and metrics tell you how often. None of the three replaces the others.
A few things worth checking before you assume your log pipeline is complete:
- Log rotation. If logs write to a file inside the container instead of stdout, confirm something is rotating them — an unbounded log file is a slow-motion disk-full incident.
- PII in logs.
fullUrl: truelogs complete request URLs, including query strings. If those ever carry tokens or user identifiers, redact before they leave the process, not after. - Log volume under load. Test what your fetch logging looks like at expected production traffic, not just in a local
next devsession with one browser tab open.
Debugging a specific fetch in production without full tracing
Full observability infrastructure is worth building, but it's not always available on day one. If you need to debug a single misbehaving fetch in production right now, a lighter path works:
- Temporarily set
fetches: { fullUrl: true }in a canary deployment or a single pod, not the whole fleet — this avoids the log volume spike from applying to every request everywhere. - Add a short-lived
console.logat the specific call site with a distinguishing marker string, so it's easy to grep out of the noise. - Pull logs directly from the runtime (
kubectl logs,docker logs) filtered to that marker, confirm the behavior, then remove the temporary logging in the next deploy.
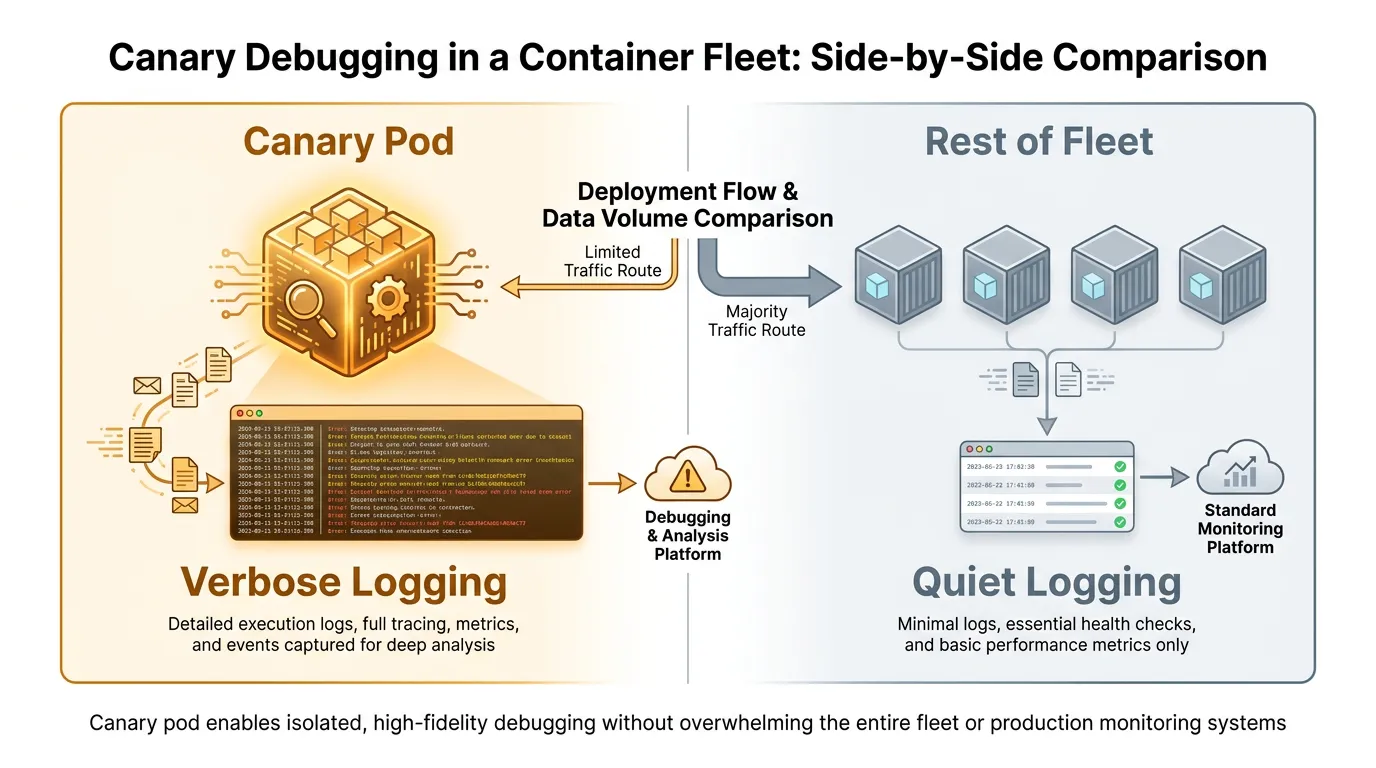
This works as a stopgap precisely because it's temporary. Leaving fullUrl: true on permanently across a whole fleet is how teams end up with the noise problem described above — treat it as a debugging tool you switch on and off, not a standing configuration.
Putting it together
next.config.js's logging option controls exactly one thing: how verbose Next.js's own fetch instrumentation is. It's a useful dial, but it's not a logging strategy on its own — that requires deciding what you log, where it goes once it leaves the container, and how it connects to the rest of your observability stack. Get the next.config.js setting right first, then decide what happens to stdout once it leaves your app.
If you're setting this up as part of a broader production-ready Kubernetes setup rather than one container at a time, it's worth seeing what that looks like end to end — logging, health checks, and rollout strategy together — before you wire up each piece yourself. Kubo runs standard Kubernetes underneath, so the logging and monitoring stack you'd build by hand is already wired in rather than something you assemble container by container.